An integrative suite for expression-aware target assignment and functional annotation of chromatin interactions.
![]()
![]()
![]()
![]()
Introduction
Welcome to looplook, a versatile R/Bioconductor toolkit developed to integrate 3D chromatin architecture data (e.g., HiChIP, ChIA-PET, Hi-C) with other tabular omics datasets, including transcriptomics, chromatin accessibility, protein-DNA interactions (derived from ChIP-seq, CUT&Tag, or CUT&RUN), and genetic variants annotated by genome-wide association studies.
Numerous studies have demonstrated that many distal regulatory elements physically interact with target gene promoters via 3D chromatin loopings, thereby regulating the expression of genes located tens of kilobases to megabases away in the linear genome. However, conventional annotations tend to assign putative elements (peaks) to their nearest genes in cis, which often fails to reflect biological reality. Hence, the accurate assignment of non-coding genetic variants or orphan peaks to their cognate target genes remains a major bottleneck in the target annotation of functional elements. To address this, looplook systematically prioritizes physical spatial chromatin contacts to batch-annotate thousands of regulatory elements at a genome-wide, high-throughput scale, thereby identifying their candidate target genes with high confidence and unprecedented efficiency.
Beyond its utility as a tool for integrative target annotation, looplook can be used as a standalone utility for loop analysis per se. Even in the absence of auxiliary omics data, it systematically annotates the 3D chromatin interactome itself, classifying complex spatial topologies (e.g., Enhancer-Promoter, Promoter-Promoter interactions) and quantifying node connectivity to uncover dense regulatory hubs and enhancer cliques (e.g., super-enhancers) that drive cell-type-specific transcriptional programs.
Installation
looplook extensively leverages the Bioconductor ecosystem for robust genomic arithmetic and annotation. To ensure optimal compatibility, please ensure your system environment is fully up to date prior to installation:
# 1. Install required annotation dependencies (Example for Human hg38)
if (!requireNamespace("BiocManager", quietly = TRUE)) install.packages("BiocManager")
BiocManager::install(c("TxDb.Hsapiens.UCSC.hg38.knownGene", "org.Hs.eg.db"))

# 2. Install looplook from GitHub
if (!requireNamespace("devtools", quietly = TRUE)) install.packages("devtools")
devtools::install_github("zying106/looplook")
Detailed Workflow & Core Modules
Module 1: Data Consolidation & Preprocessing
In 3D genomics analyses, individual replicates typically exhibit certain degrees of inconsistency or noise. The consolidate_chromatin_loops function serves as the foundational data-cleaning module, merging multiple replicates into a standardized, unified 3D chromatin interaction coordinate framework.
Key Parameters:
-
mode: Defines the overarching merging algorithm. The"consensus"mode (recommended) employs graph-based connected component analysis to cluster nearby chromatin loop anchors across biological/technical samples. The"intersect"mode applies strict reference-based filtering to retain only overlapping interactions, while the"union"mode retains all detected interactions for exploratory pan-tissue analyses. -
min_raw_score&min_score(The Dual-Filter):min_raw_scoreacts as a pre-filter applied to individual BEDPE files before clustering (e.g., removing singleton noise to substantially reduce computational memory overhead).min_scoreserves as a post-filter applied to the final merged chromatin interactome to ensure high-confidence interactions. -
gap: Defines the maximum spatial distance (in base pairs) allowed between loop anchors for consideration as part of the same physical cluster. -
blacklist_species: Automatically excludes chromatin loops overlapping with high-variance, artifact-prone genomic regions (e.g., centromeres, telomeres) by integrating the official ENCODE blacklist for specified species (e.g.,"hg38","mm10"). -
region_of_interest: Accepts an auxiliary BED file (e.g., a specific disease-associated locus or ChIP-seq peak set) to exclude global background interactions, outputting only loops with physical connectivity to the target genomic region.
library(looplook)
out_dir <- tempdir()

# Execute consensus merging with strict Quality Control
consensus_global <- consolidate_chromatin_loops(
  files = c("rep1.bedpe", "rep2.bedpe"),
  mode = "consensus",
  gap = 1000,
  min_raw_score = 2,           # Pre-filter sequencing noise
  blacklist_species = "hg38",  # Apply ENCODE artifact blacklist
  out_file = file.path(out_dir, "consensus_loops.bedpe")
)
Module 2: 3D-Guided Peak Annotation & Mapping
This module serves as the core target mapping engine. It seamlessly executes a rigorous hierarchical pipeline to resolve locus assignment conflicts: Expression Pre-filter → Functional Biotype Prioritization → Dominant Expression Tiebreaker.
Key Parameters:
-
target_bed: pecifies the auxiliary genomic features of interest (e.g., GWAS SNPs, ATAC-seq peaks, or transcription factor binding sites) that require spatial target gene assignment. -
expr_matrix_file&sample_columns: Providing an RNA-seq matrix allows the engine to activate the Expression Pre-filter and Tiebreaker logic, drastically reducing false-positive gene assignments in genomic regions harboring multiple genes. -
neighbor_hop: An advanced topological parameter for 3D chromatin interactome network traversal. A value of 0 restricts annotation to direct physical chromatin interactions only; a value of 1 (Hub Mode) extends analysis to secondary network effects within enhancer cliques. -
tss_region: Defines the spatial boundary of gene promoters relative to the Transcription Start Site (TSS).
# Map auxiliary genomic features to 3D loops and resolve multi-gene conflicts
res_integrated <- annotate_peaks_and_loops(
  bedpe_file = file.path(out_dir, "consensus_loops.bedpe"),
  target_bed = "atac_peaks.bed",
  expr_matrix_file = "rna_tpm.txt",
  sample_columns = c("con1", "con2"),
  species = "hg38",
  neighbor_hop = 0,
  hub_percentile = 0.95,
  out_dir = out_dir,
  project_name = "Integrative_Annotation"
)
Output Data Dictionary: The Comprehensive 3D Spatial Catalog
The module systematically exports a multi-layered tabular catalog (e.g., *_Basic_Results.xlsx) detailing the spatial interactome:
Integrative Target Mapping (
target_annotation) Delineates the spatial coverage of genomic variants/features inputted by the user. It strictly differentiatesAssigned_Target_Genes(target genes identified exclusively via 3D physical chromatin loops) from*_Filled columns, which implement a “Smart Fallback” algorithm to assign nearest linear genes for unlooped loci, ensuring comprehensive, gap-free annotation coverage.3D Network Architecture (
loop_annotation) Resolves the biological syntax of the structural interactome. It classifies topological interactions (loop_type, e.g., E-P, P-P) and distinguishes biologically relevantPutative_Target_Genesfrom the broader, raw physical interaction footprints (All_Anchor_Genes).Topological Hub Detection Quantifies structural node degrees (e.g.,
n_Linked_Promoters,n_Linked_Distal) to rigorously deconstruct the 3D interactome from two complementary perspectives:promoter_centric_stats: Identifies core target genes regulated by complex regulatory architectures (e.g., enhancer arrays or transcription factories),whiledistal_element_statshighlights high-connectivity non-coding regions to facilitate the discovery of putative enhancer cliques.
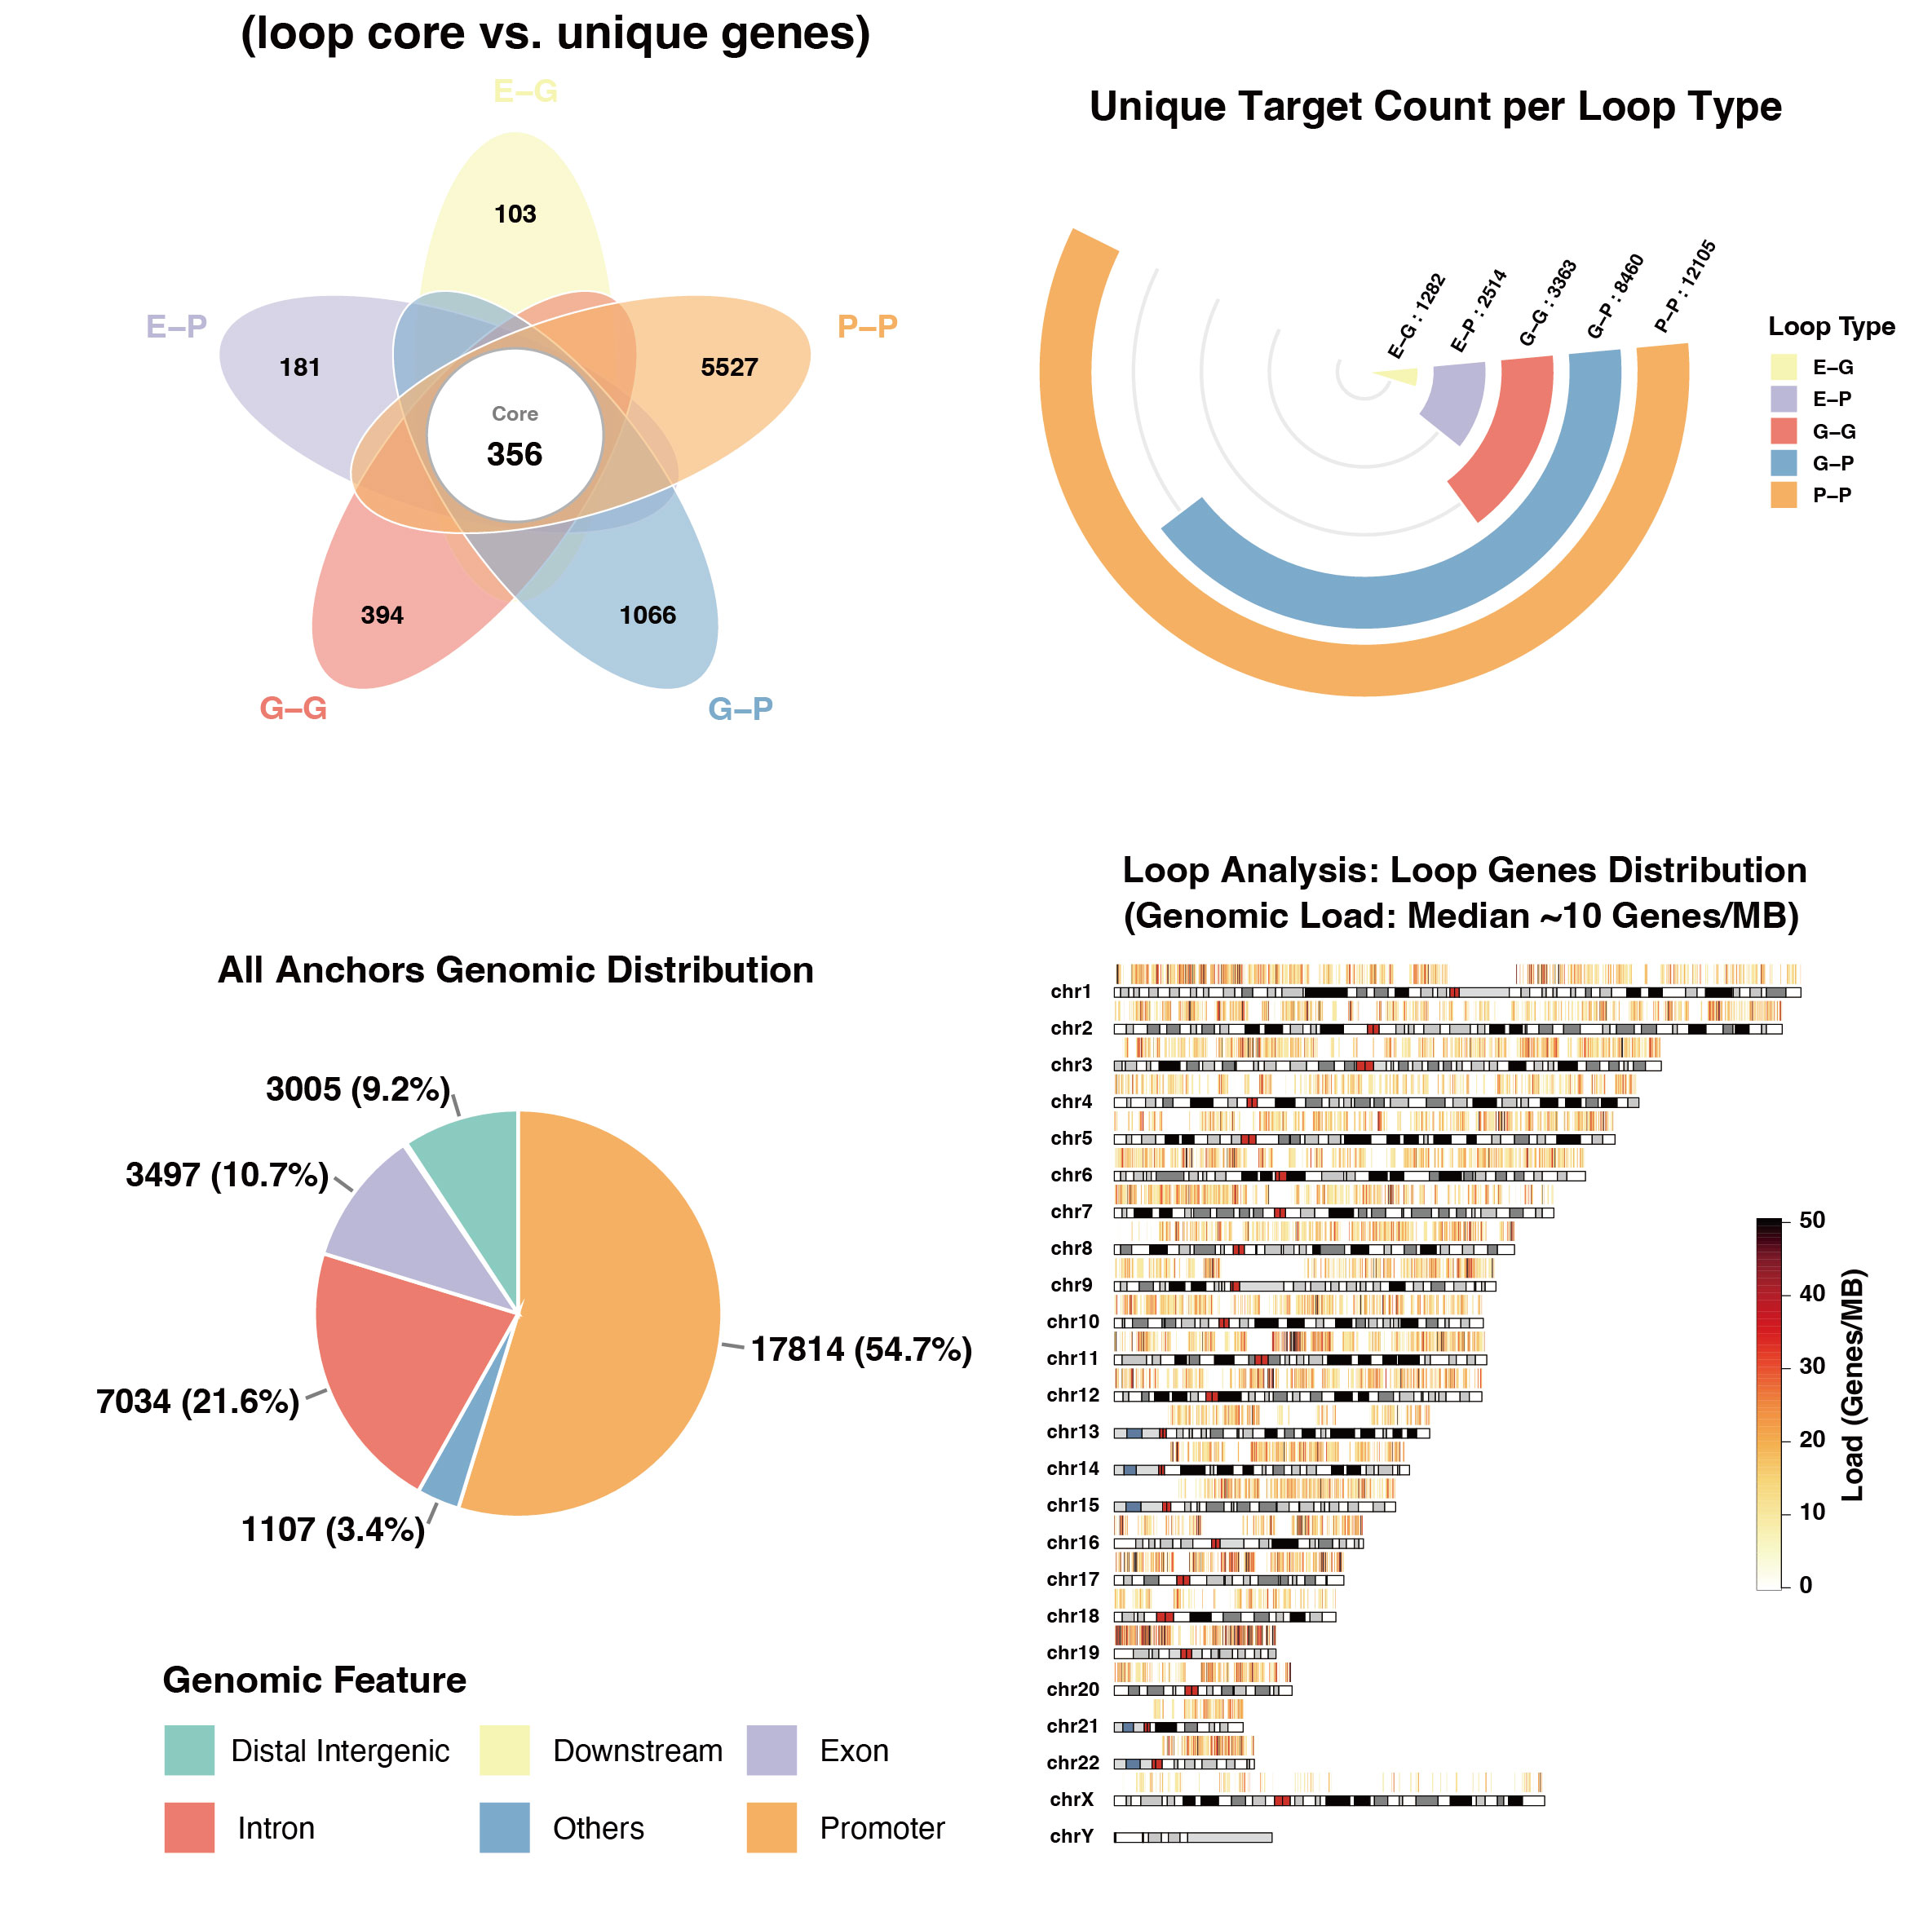
Figure 1: Representative outputs of 3D-Guided Annotation. This composite plot displays a curated subset of the automated profiling suite, featuring macro-scale chromosomal ideograms and topological overlap analysis of the annotated 3D interactome.
Module 3: Expression-Aware Refinement
Physical proximity is a structural prerequisite, but not a direct proxy for active transcriptional regulation. This module integrates quantitative transcriptome data to systematically filter out transcriptionally silent physical chromatin contacts, ensuring only functionally relevant 3D interactions are retained.
Key Parameters:
-
threshold&unit_type: Defines the quantitative cutoff (e.g.,threshold = 1.0,unit_type = "TPM") required to consider a gene biologically active. This parameter enables downward compatibility with various normalization methods. -
reclassify_by_expression: When enabled (TRUE), transcriptionally silent promoters are not simply discarded; instead, they are biologically reclassified to enhancer-like regulatory elements. This correction refines the regulatory topology (e.g., reclassifying a functionally silent P-P loop into a curated eP-P loop).
# Expression-Aware Reclassification (Recommended)
refined_res <- refine_loop_anchors_by_expression(
  annotation_res = res_integrated,
  expr_matrix_file = "rna_tpm.txt",
  sample_columns = c("con1", "con2"),
  threshold = 1,
  unit_type = "TPM",
  reclassify_by_expression = TRUE,
  out_dir = out_dir,
  project_name = "Refined_Network"
)
Output Data Dictionary: The Functionally Active Regulome Following transcriptome integration, the refined tabular outputs represent a high-confidence, functionally active subset of the initial 3D chromatin interactome. The key features of these output are as follows:
- Expression-Aware Filtration: The resulting catalog explicitly excludes pure structural chromatin loops lacking functional transcriptional output, yielding a rigorously curated, functionally active regulatory network.
-
Dynamic Topological Reclassification: The topological annotations within the
loop_typeare biologically recalibrated. By dynamically reclassifying transcriptionally silent promoters (P) as enhancer-like elements (eP), the catalog fundamentally corrects the spatial regulatory syntax (e.g., seamlessly transforming a transcriptionally silent P-P loop into a curated eP-P interaction axis).
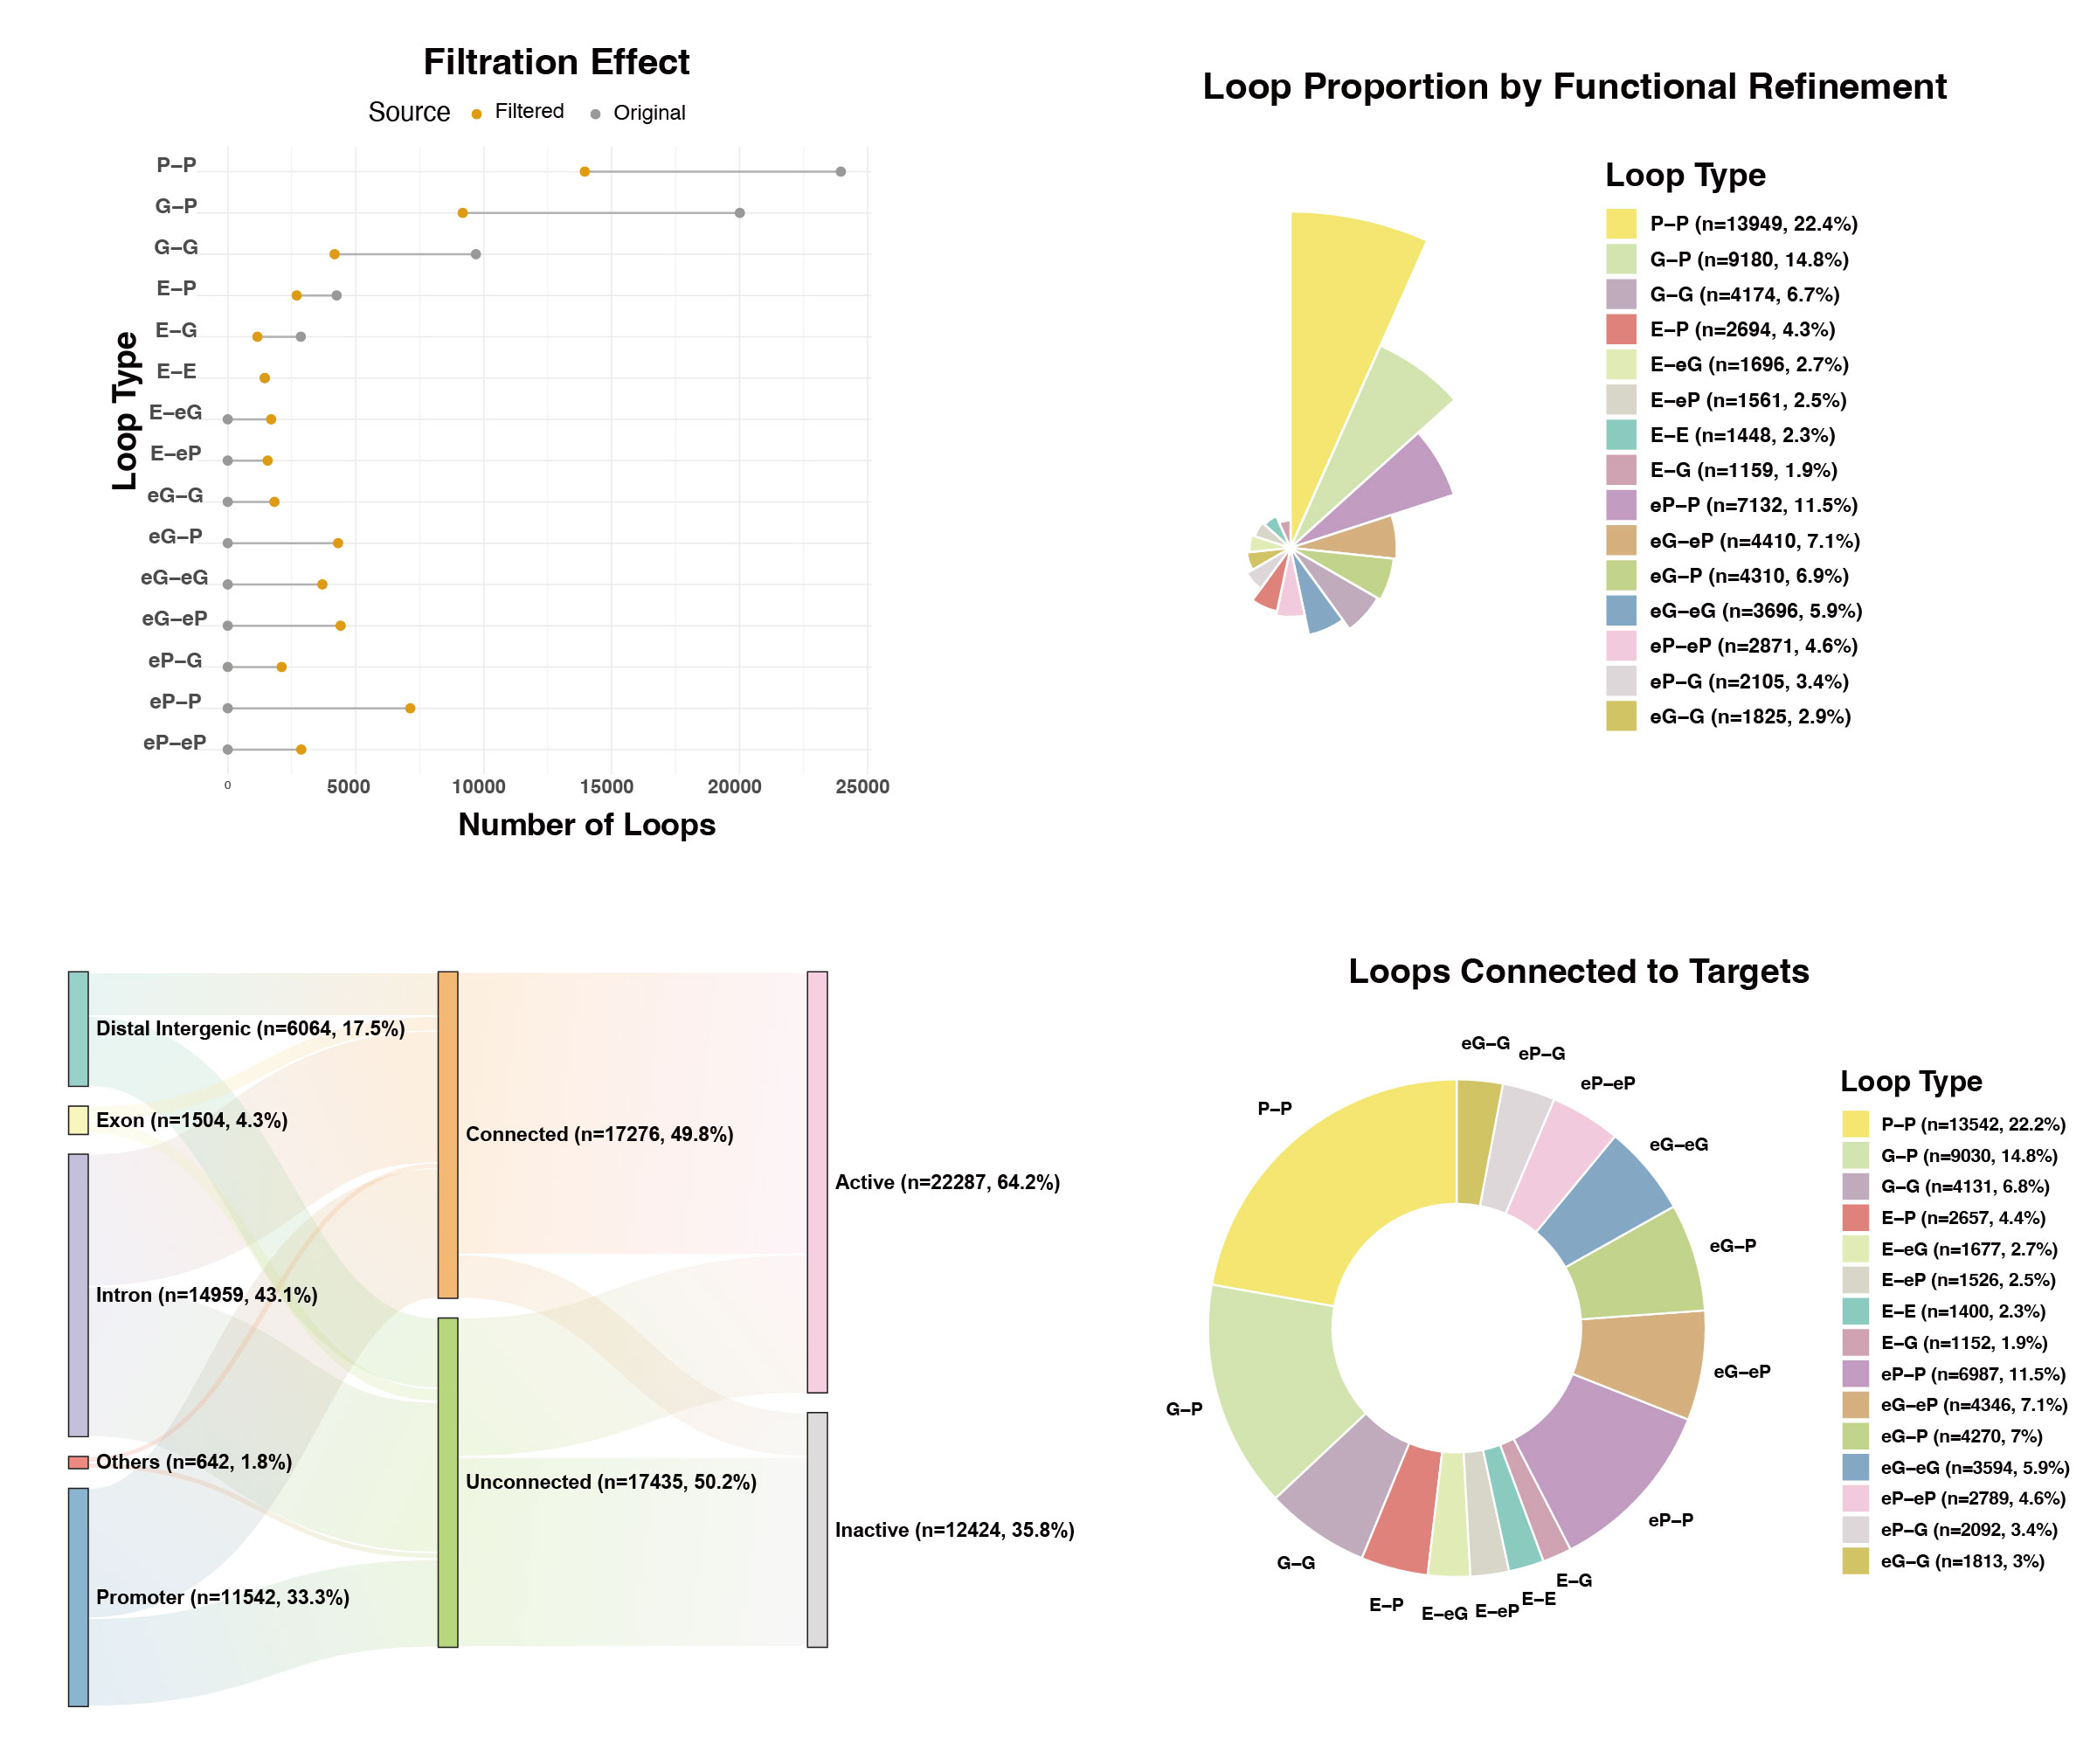
Figure 2: Representative outputs of Expression-Aware Refinement. As shown by the Multi-Omics Sankey Tracking, this curated visualization dynamically traces the fate of peak through 3D chromatin topological interactions to their corresponding transcriptionally active target genes.
Module 4: Automated Functional Profiling
This module provides a fully automated, end-to-end multi-omics analysis pipeline that integrates 3D genomic interactions with transcriptomic data to unveil the regulatory mechanisms of targets of interest.
Key Parameters:
-
target_source(The Biological Scope) Defines the biological scope of functional profiling.-
"targets": Focuses exclusively on the putative target genes regulated by inputted genomic features (Peak-Centric mode). -
"loops": Evaluates the entire 3D interactome independently of the inputted genomic features (Global Network-Centric mode).
-
-
target_mapping_modeControls the stringency of 3D target assignment."all"accepts broad 3D target regulation, while"promoter"is highly stringent, requiring 3D loops to explicitly anchor at canonical promoter regions, excluding distal E-G connections. -
include_Filled(The Stringency Toggle) Adjusts the stringency of annotation integration.-
TRUE(Hybrid Mode): Utilizes the comprehensively merged annotation, prioritizing 3D loop-derived target genes while rescuing unlooped genomic elements by assigning them to their nearest linear genes. -
FALSE(Pure Spatial Mode): Strictly isolates and analyzes only the 3D interactome.
-
-
use_nearest_gene(The Control) Serves as a classical baseline reference. If set toTRUE, the engine bypasses 3D spatial topology and strictly assigns genomic features to their nearest linear genes, facilitating a direct comparison to demonstrate the novel functional insights gained from 3D-guided mapping.
# Comprehensive Integrative Profiling (RNA-seq + Spatial Hubs + JASPAR + GO/PPI)
res_profile <- profile_target_genes(
  annotation_res = refined_res,
  diff_file = "deseq2_res.txt",
  lfc_col = "log2FoldChange",
  expr_matrix_file = "rna_tpm.txt",
  metadata_file = "sample_metadata.txt",
  target_source = c("loops", "targets"),
  target_mapping_mode = "all",
  include_Filled = TRUE,
  use_nearest_gene = FALSE,
  project_name = "Functional_Profiling",
  out_dir = out_dir,
  run_motif = TRUE,
  run_go = TRUE,
  run_ppi = TRUE
)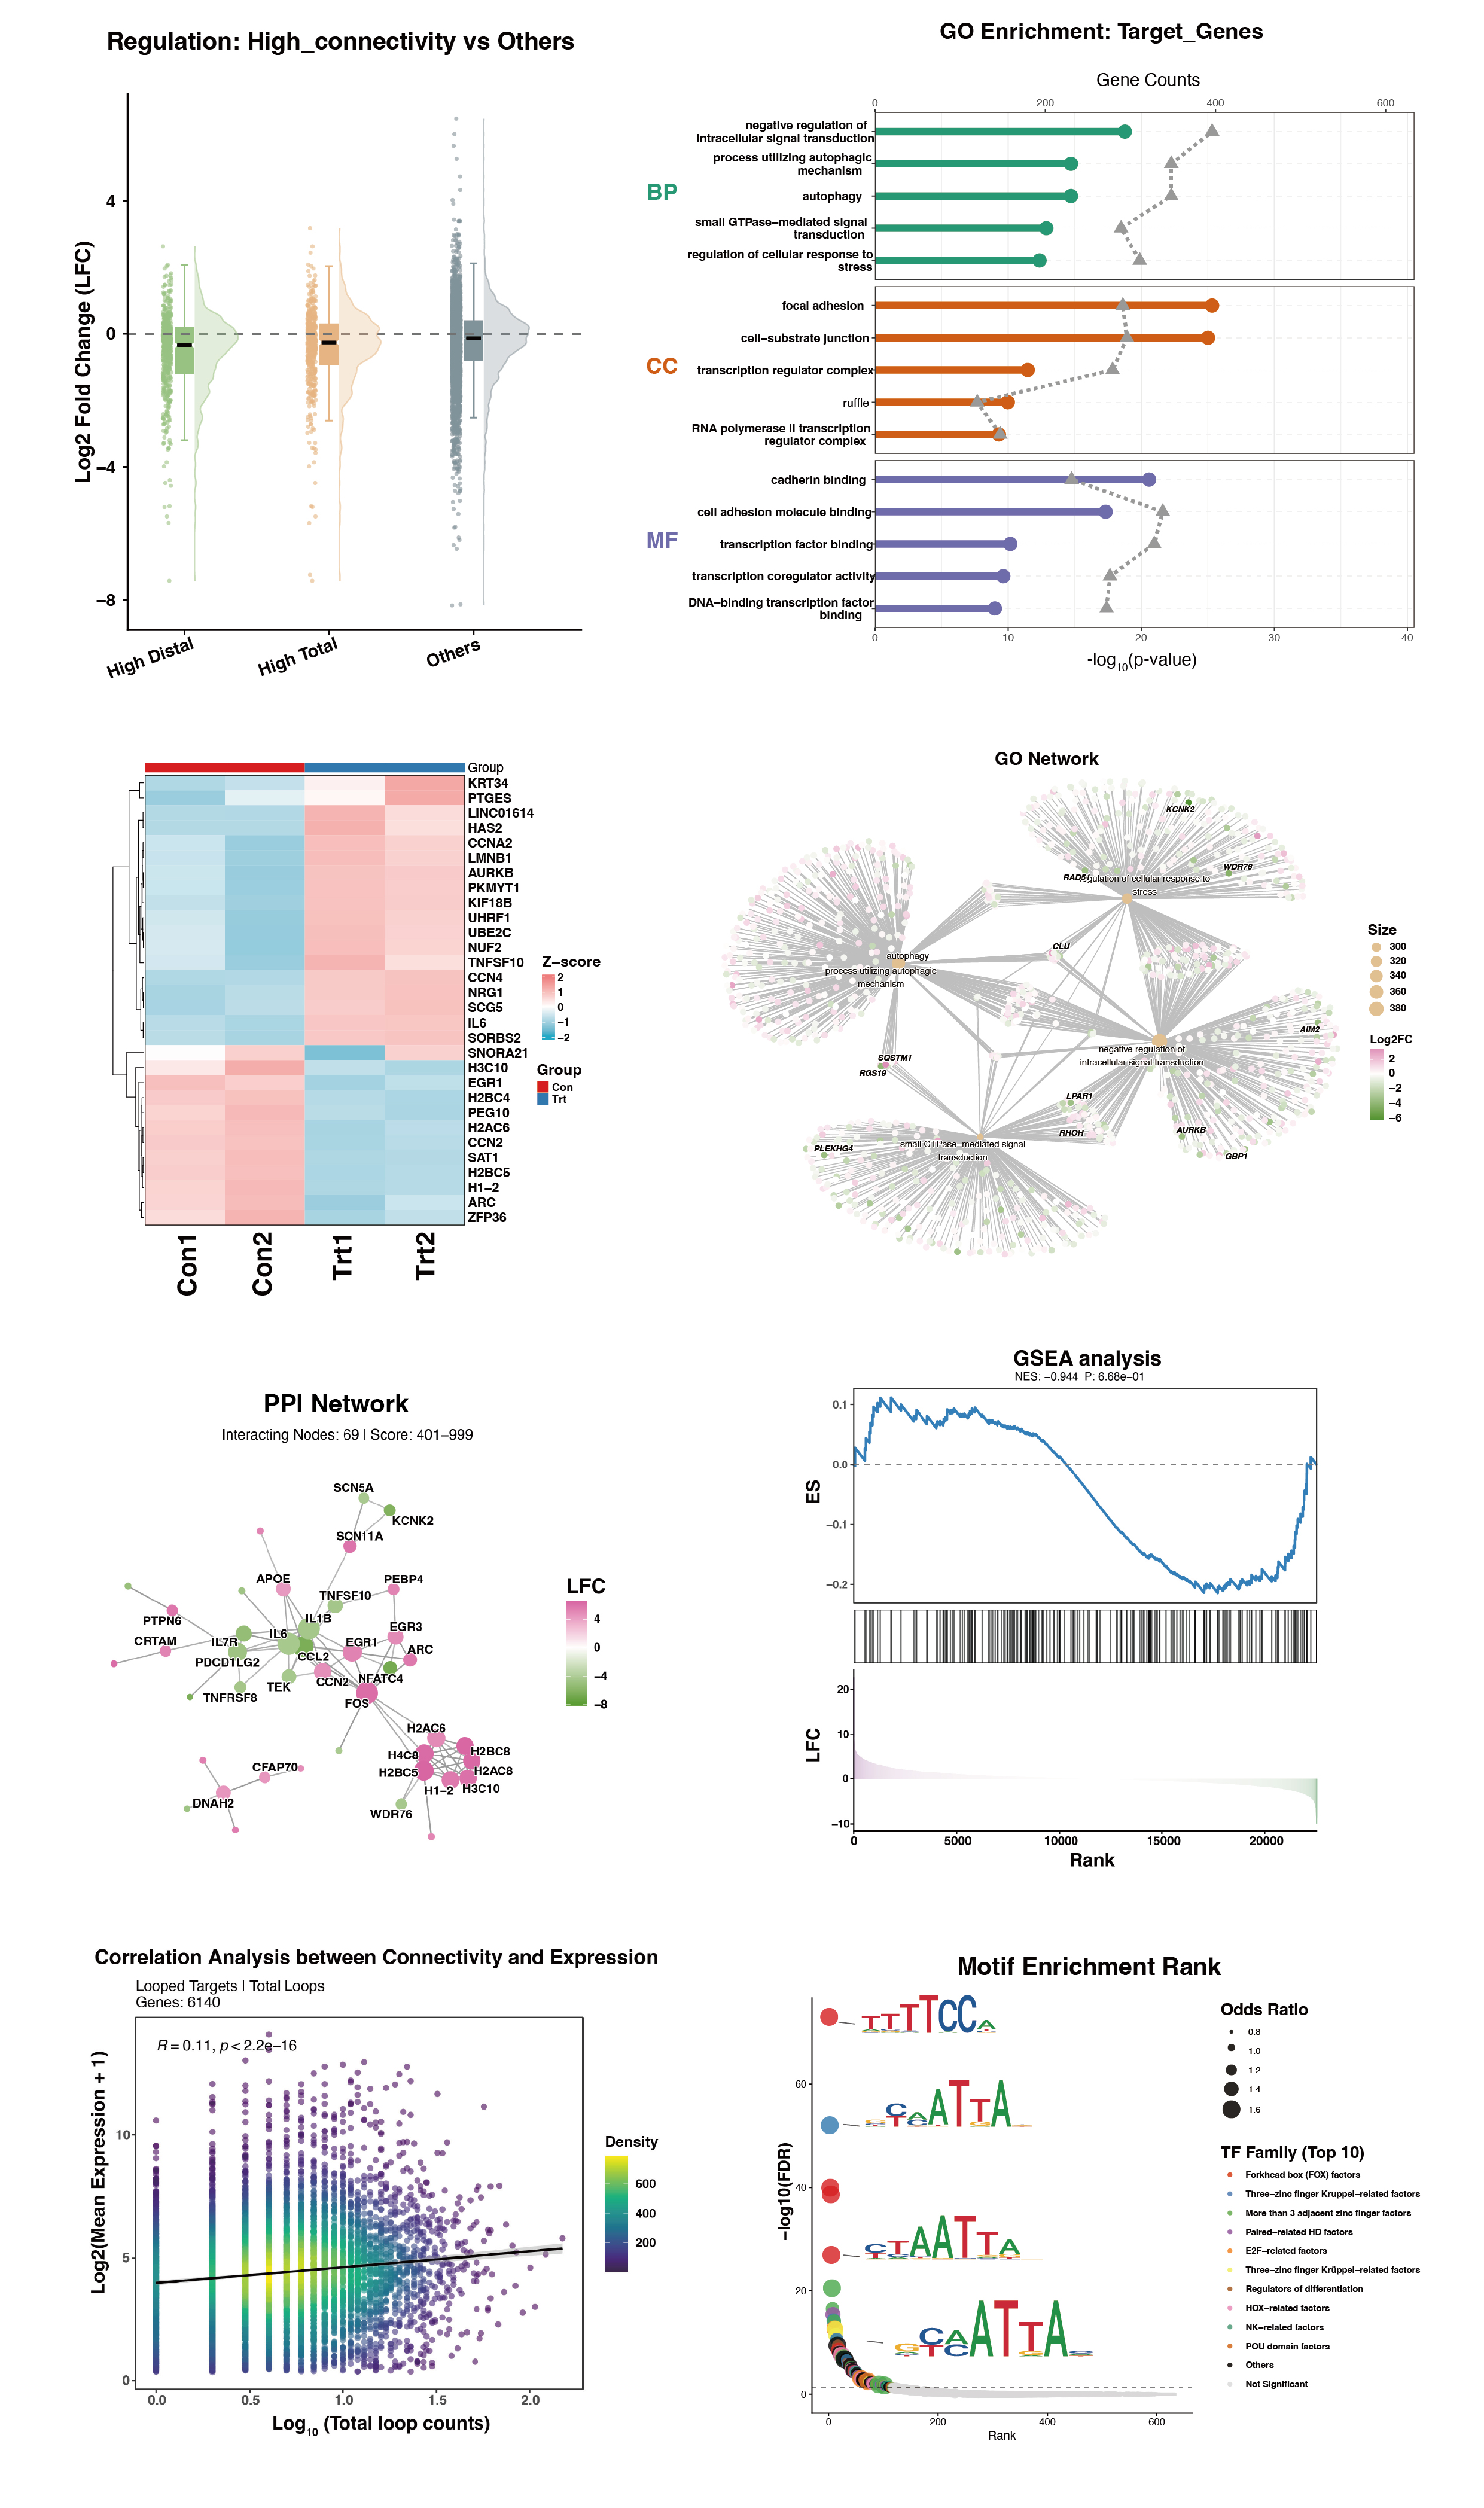
Figure 3: Representative outputs of Functional Profiling. This curated composite highlights Divergent Concept Networks and Asymmetric Motif Signatures, offering a partial glimpse into the downstream visualizations that decode the trans-regulatory logic of the spatial hubs.
Module 5: IGV-Style Track Visualization
This module precisely renders the local 3D chromatin spatial interactome through a multi-tiered genomic browser-style visualization interface, similar to the layout of the Integrative Genomics Viewer (IGV).
Key Parameters:
-
score_to_alphaLogical parameter. IfTRUE, it maps quantitative chromatin interaction scores to the alpha (transparency) channel of the Bezier arcs, enabling visual differentiation of interaction strength. -
speciesSpecifies the organism of interest, directing the function to automatically load the correspondingTxDbandOrgDbBioconductor packages. This ensures precise rendering of gene tracks, including exon-intron structures and strand directionality.
library(ggplot2)

# Generate an integrative multi-omics locus track
track_plot <- plot_peaks_interactions(
  bedpe_file = file.path(out_dir, "consensus_loops.bedpe"),
  target_bed = "atac_peaks.bed",
  chr = "chr1",
  from = 11884299,
  to = 12106581,
  species = "hg38",
  save_file = file.path(out_dir, "Locus_Track.pdf")
)
print(track_plot)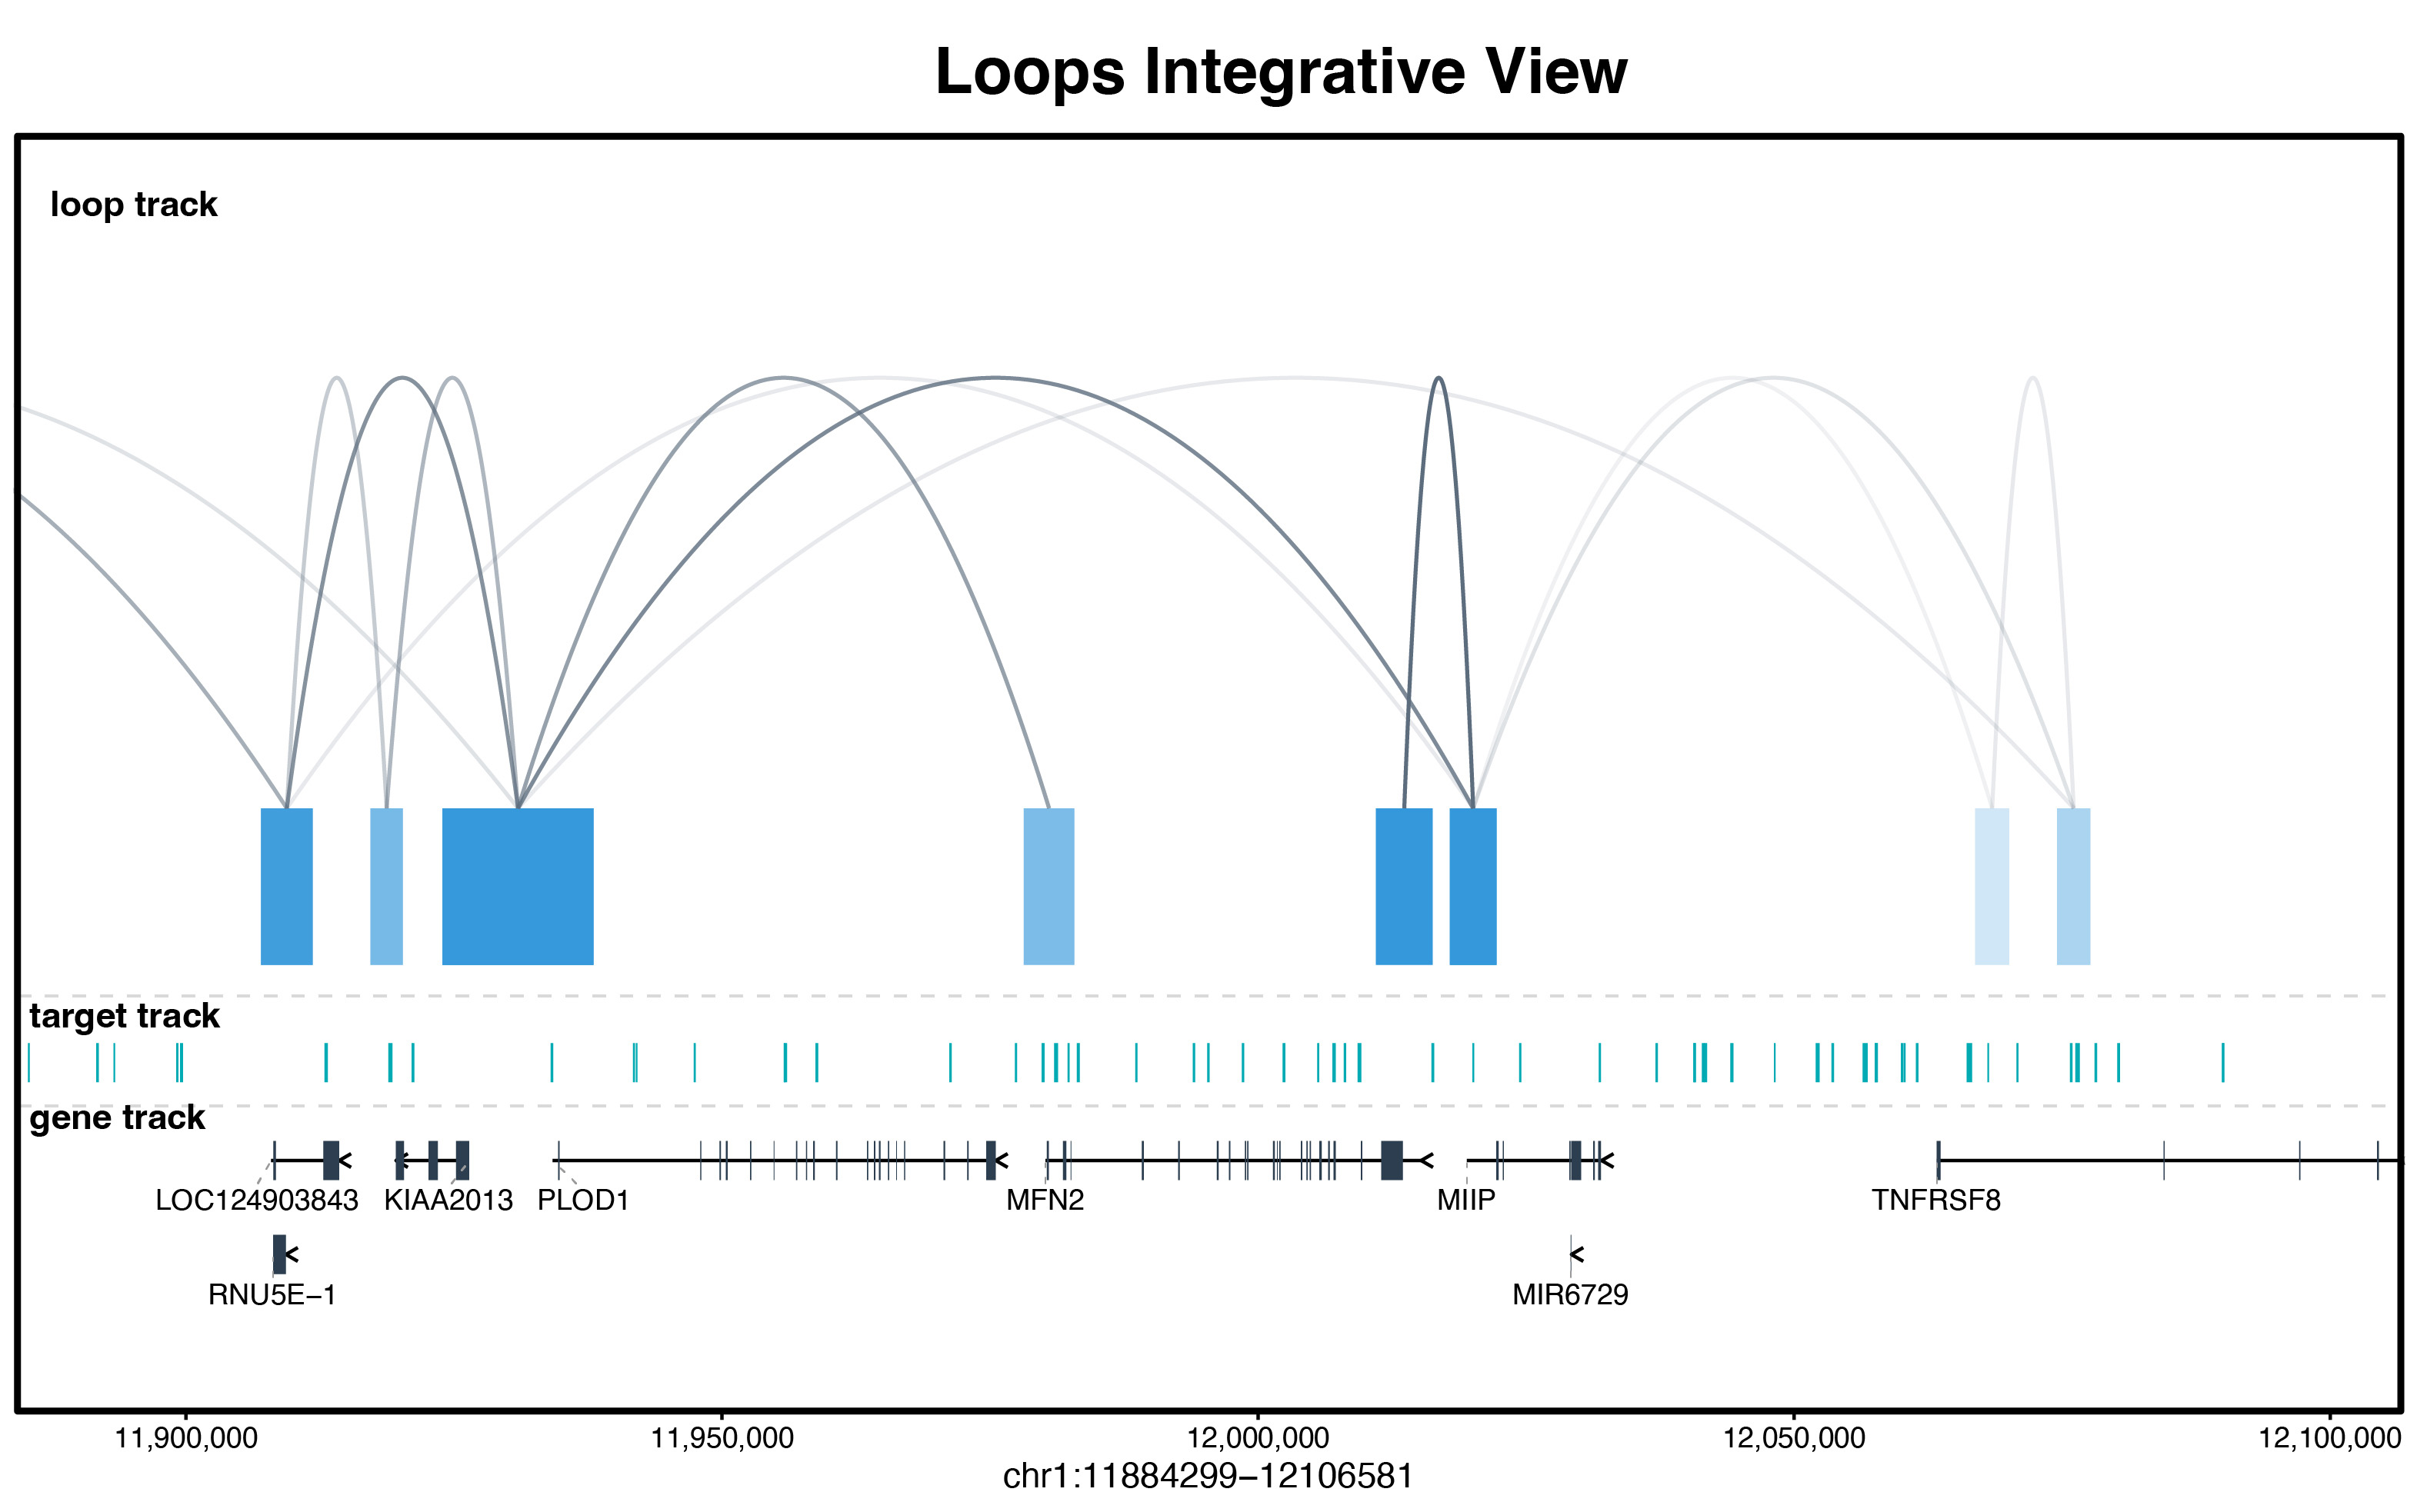
Figure 4: Integrative genomic browser view displaying 3D chromatin loops, genomic regions, and directional gene models.
Contact
Ying ZHANG Zhejiang University
Email: 12207129@zju.edu.cn
For bug reports, feature requests, or questions regarding the package, please open an issue at the looplook GitHub repository.
Session Information
For reproducibility, looplook is developed and tested under the following environment:
## R version 4.5.1 (2025-06-13)
## Platform: aarch64-apple-darwin20
## Running under: macOS Sequoia 15.3
##
## Matrix products: default
## BLAS:   /Library/Frameworks/R.framework/Versions/4.5-arm64/Resources/lib/libRblas.0.dylib
## LAPACK: /Library/Frameworks/R.framework/Versions/4.5-arm64/Resources/lib/libRlapack.dylib;  LAPACK version 3.12.1
##
## locale:
## [1] en_US.UTF-8/en_US.UTF-8/en_US.UTF-8/C/en_US.UTF-8/en_US.UTF-8
##
## time zone: Asia/Singapore
## tzcode source: internal
##
## attached base packages:
## [1] stats     graphics  grDevices utils     datasets  methods   base
##
## loaded via a namespace (and not attached):
##  [1] compiler_4.5.1    fastmap_1.2.0     cli_3.6.5         tools_4.5.1
##  [5] htmltools_0.5.8.1 otel_0.2.0        rstudioapi_0.17.1 yaml_2.3.10
##  [9] rmarkdown_2.30    knitr_1.51        xfun_0.55         digest_0.6.37
## [13] rlang_1.1.6       evaluate_1.0.5